
Branded traffic comes from searches containing your company or brand name (for example, “Nike trainers” or “Sports Direct returns”), while non-branded traffic comes from generic searches related to your products or services (for example, “running shoes” or “football boots”). Non-branded traffic is the primary indicator of true SEO growth because it reflects discovery from users who found you through search engines like Google, not prior brand familiarity.
Put simply: if branded traffic tells you how much demand already exists for your business, non-branded traffic tells you how visible you are to people who were not specifically looking for you. That is why the brand vs non-brand split is one of the clearest ways to judge whether SEO is driving incremental reach or simply harvesting existing awareness.
Try the Non-branded vs branded tool: Connect Search Console, define your brand terms, and see your brand dependency risk in minutes – no account required, no data stored, no spreadsheets.
Summary: How to measure branded vs non-branded traffic
- Branded traffic = queries containing your brand name or brand variations.
- Non-branded traffic = queries that do not contain your brand name.
- Non-branded traffic is the most accurate indicator of SEO-driven growth.
- You can measure this using Google Search Console query filters or regex patterns.
- Tracking this split reveals whether SEO is driving discovery or just capturing existing demand.
- Looking at the split over time helps you separate true SEO growth from demand generated by brand marketing, PR, email, offline campaigns, or repeat customers
Most SEO dashboards answer the wrong question. They show:
- Total clicks
- Total impressions
- Average position
- YoY growth
But they don’t answer the question that matters most.
Is your organic growth coming from discovery or from brand demand? True organic growth comes primarily from non-branded queries, because they represent new customer acquisition rather than existing brand awareness.
If 75% of your clicks come from brand searches, you don’t necessarily have SEO growth. You might just have brand awareness. And those are two very different things. So I built a tool to make the split systematic.
This is where many reports become misleading. A month with rising clicks can look positive on the surface, but if most of that gain came from branded demand, your SEO efforts may not actually have expanded your visibility in search. Separating brand and non-brand is what turns a surface-level traffic report into a strategic SEO report.
What Are Branded vs Non-Branded Keywords?
Definition: Branded keywords are search queries that include your brand name or brand-specific variations. Non-branded keywords are generic queries that do not reference your brand and represent discovery-driven traffic.
This classification is universally used in SEO, analytics platforms, and search engine reporting to separate navigational demand from discovery-driven search visibility.
Let’s define it clearly.
Branded Keywords
Branded keywords include:
- Your company or brand name
- Product names unique to your business
- Common misspellings
- Navigational variations
Examples:
- sports direct
- sportsdirect com
- sports direct trainers
- how to return sports direct
These searches indicate the user already knows your brand and intends to navigate to your website.
Branded keywords tend to have:
- Higher CTR
- Higher conversion rates
- Stronger ranking stability
- Lower volatility
Non-Branded Keywords
Non-branded keywords are generic queries related to your products or services that do not reference your brand.
Examples:
- running shoes
- football boots
- best trail trainers
- waterproof jacket
These queries represent discovery-stage users who are evaluating options and have not yet chosen a brand. Non-branded traffic is the most important KPI for SEO-driven acquisition because it reflects your ability to attract new users through search visibility rather than brand demand.
For most businesses, non-branded keywords are also where the biggest growth opportunity sits. Branded demand is naturally constrained by how many people already know you. Non-branded demand is usually much greater because it reflects the total search market for the products, services, or topics you want to win visibility for.
Why This Split Matters More Than Most Teams Realise?
Separating branded and non-branded traffic allows you to measure whether SEO is creating new demand or simply capturing existing brand interest. Branded vs. non-branded traffic behaves very differently.
| Factor | Branded | Non-Branded |
|---|---|---|
| CTR | Very high | Competitive |
| Intent | Navigational | Informational / Transactional |
| Volatility | Stable | More volatile |
| Influenced by brand marketing | Yes | Less so |
| True SEO growth indicator | No | Yes |
Non-branded traffic growth indicates expanding organic visibility, while branded traffic growth often reflects brand marketing, PR, or offline awareness. If you’re not separating them, you can’t answer:
- Is SEO expanding our reach?
- Or are we just capturing demand generated elsewhere?
- Are we dependent on brand?
- Is discovery compounding?
- Which pages are genuinely attracting new visitors versus simply serving existing brand demand?
- Is growth coming from category pages, product pages, or informational content?
That last point matters more than many teams realise. Once you can separate brand and non-brand traffic, you can go a level deeper and assess which page types are responsible for acquisition. For e-commerce sites, that often means understanding whether non-brand growth is coming from collection pages, product pages, or content hubs. That is far more useful than looking at sitewide traffic alone.
How to Measure Branded vs Non-Branded Traffic in Google Search Console?
You can separate branded and non-branded traffic directly in Google Search Console using query filters or regex patterns. Google Search Console is the primary source of truth for measuring organic search performance because it provides direct query-level data from Google’s search index. Every organic click recorded in Search Console originates from a user search, making it the most reliable dataset for measuring branded vs non-branded visibility.
Manual method:
- Go to Performance → Search Results
- Click + New → Query
- Select:
- “Queries containing” → to see branded traffic
- “Queries not containing” → to see non-branded traffic
For accuracy, use regex patterns to capture brand variations and misspellings.
Example regex: sports?\s*direct|sdirect|sportsdirect
This allows you to classify queries consistently across all months and devices. The problem is that this process is manual, repetitive, and difficult to maintain.
It also breaks down quickly once you want proper reporting. Native Search Console filtering is fine for spot checks, but it becomes painful when you want to analyse multiple months, apply consistent brand logic, segment by page type, compare time periods, or share a repeatable view with stakeholders. That is usually the point where people end up in Google Sheets or Excel.
The Problem: Segmenting Brand vs Non-Brand Is a Pain
Most teams try to do this manually. The usual process looks like this:
- Apply regex filters in Search Console
- Export branded queries
- Remove filter
- Export non-branded queries
- Merge in Excel
- Recalculate totals
- Repeat monthly
This creates inconsistencies and prevents teams from tracking true organic discovery reliably over time. It works. But it’s fragile, time-consuming, and inconsistent across teams. And most companies never maintain it properly.
Even worse, different people often use slightly different brand definitions. One report may include misspellings, another may not. One may count sub-brands, another may ignore them. Once that happens, trend lines stop being comparable. The output looks precise, but the methodology is not.
There is also a practical data issue. Search Console’s interface is not designed to be a clean long-term workflow for this kind of segmentation. If you want a reliable month-by-month view, a page-type breakdown, or a consistent classification model, you need a repeatable system rather than a one-off export process.
So I built a simpler approach.
Introducing Organic Trends Tool: Segment Brand vs Non-Brand in Minutes
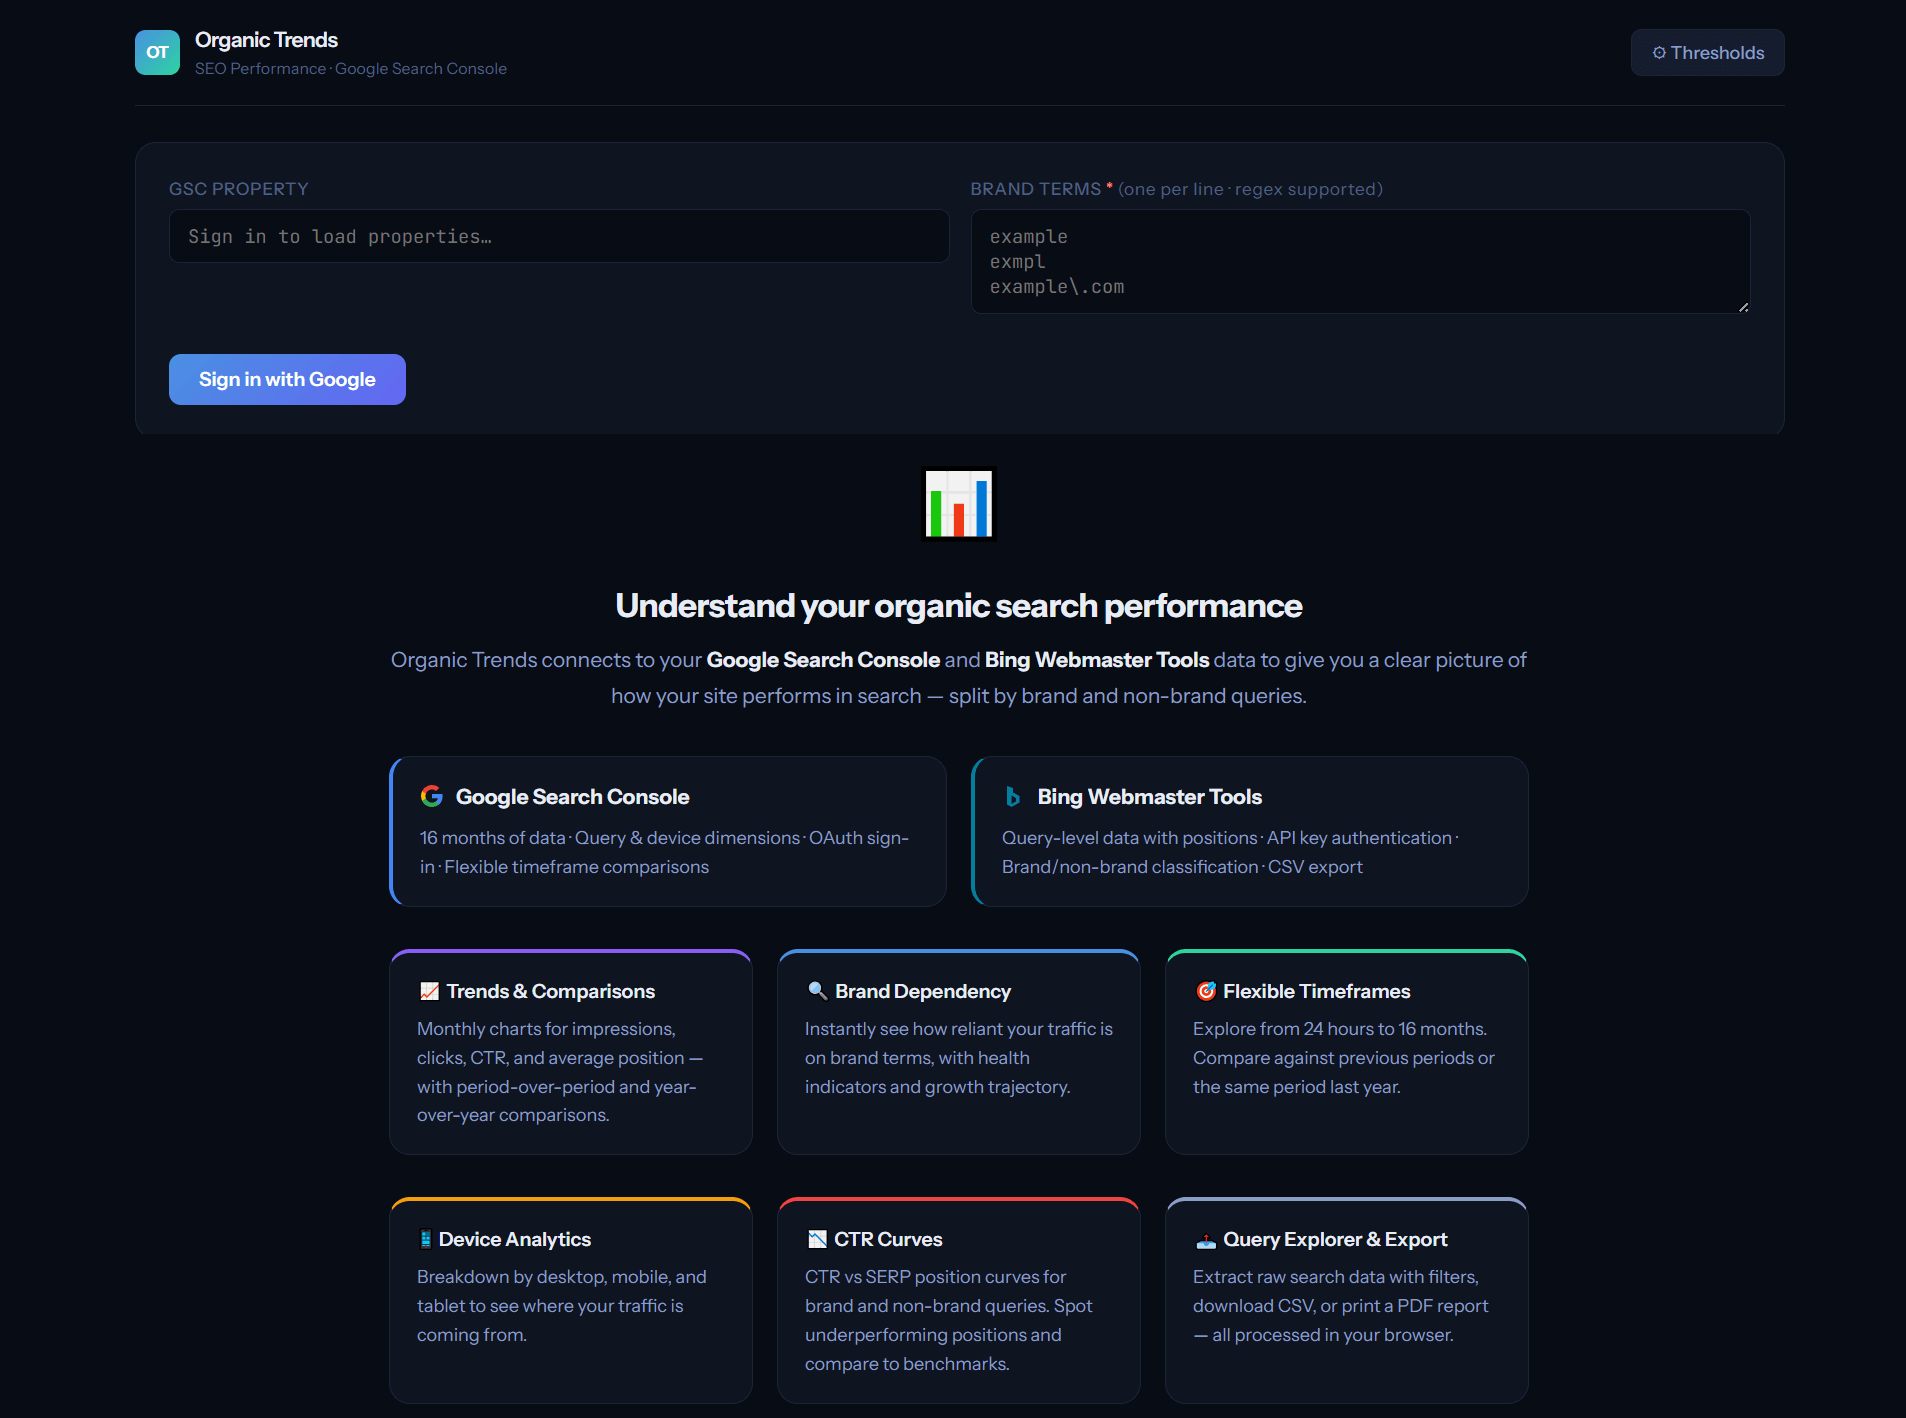
Organic Trends is a browser-based tool that connects directly to Google Search Console and automatically classifies every query as branded or non-branded using regex patterns. Unlike manual spreadsheet workflows, the classification is applied consistently across all historical data, ensuring accurate measurement of brand dependency trends over time. This enables SEO teams to monitor discovery growth, brand reliance, and organic acquisition performance without manual query filtering.
The tool connects directly to:
- Google Search Console – 16 months of data, query and device dimensions, OAuth sign-in.
- Bing Webmaster Tools – Query-level data with positions, API key authentication, brand/non-brand classification.
No data is stored. Processing happens in your browser. Read-only access only.
How it works
- Connect your GSC property (and optionally your Bing account)
- Enter your brand terms (regex supported)
- Click Fetch & Analyse
What the Tool Shows
- Brand Dependency Risk
Brand dependency risk measures the percentage of organic clicks driven by branded queries versus discovery queries.
Metrics include:
- Brand Click Share
- Non-Brand Click Share
- Non-Brand Trend
- Risk Label
If branded traffic exceeds 70–80% of total clicks, the site is considered highly brand-dependent.
2. Trends Over Time
Track:
- Impressions
- Clicks
- CTR
- Average Position
Up to 16 months.
That means you are not just seeing a static split. You can see whether non-brand discovery is improving, plateauing, or shrinking over time. In practice, this is often more important than the absolute percentage itself. A site with a currently high brand share may still be moving in the right direction if non-brand visibility is steadily growing month after month.
This allows you to identify whether SEO visibility is expanding through discovery or remaining dependent on brand demand. This distinction has become even more important with the rise of AI-powered search systems such as Google AI Overviews, ChatGPT, and Bing Copilot, which prioritise authoritative pages that demonstrate broad topical visibility beyond brand-specific queries.
Websites with strong non-branded visibility are more likely to be cited in AI-generated answers because they are recognised as authoritative sources on a topic, rather than navigational destinations.
3. Query-Level Classification
Each query is labelled:
- Brand
- Non-Brand
With:
- Impressions
- Clicks
- CTR
- Position
This enables prioritisation of high-impression non-branded keywords with growth potential.
You can then move from reporting into action: identify high-impression non-brand queries with weak CTR, queries ranking just outside the top positions, or topic areas where branded demand dominates because broader discovery visibility is underdeveloped.
Go Beyond Sitewide Reporting: Analyse by Page Type
One of the most useful extensions of this analysis is to look at where brand and non-brand traffic are landing. For e-commerce sites, that often means separating collection pages from product pages. For publishers or SaaS businesses, it could mean comparing blog content, feature pages, guides, or templates.
Why does this matter? Because sitewide brand and non-brand numbers can hide what is really happening underneath. A site may have healthy non-brand growth overall, but all of it could be concentrated in one page type. Another site may appear brand-heavy overall, while category pages are quietly growing non-brand discovery, and product pages are lagging.
Once you segment by page type, the analysis becomes far more actionable. You can answer questions like:
- Are category pages driving most of our non-brand acquisition?
- Are product pages overly reliant on branded demand?
- Is editorial content introducing new users who later convert elsewhere?
Try the Tool
You’re minutes away from seeing your split clearly.
- Connect Search Console
- Define your brand terms
- See your dependency risk
Open Organic Trends (Brand vs Non-Brand)
No account required. No data stored. No spreadsheets.
Why This Matters for SEO Strategy
The primary goal of SEO is to increase non-branded traffic, because this reflects new user acquisition and expanded search visibility.
- If brand share rises but non-brand remains flat, SEO growth is not occurring.
- If non-brand impressions and clicks increase over time, SEO visibility is expanding.
- If branded traffic spikes while non-brand stays unchanged, the cause may sit outside SEO altogether, such as brand campaigns, PR, retail activity, or seasonality.
- If non-brand grows first at the impression level and only later in clicks, that is often an early sign that visibility is improving before rankings fully mature.
This is why the split is so useful in stakeholder conversations. It helps explain not just what changed, but why it changed. It gives SEO teams a way to distinguish visibility growth from demand capture and to defend performance using something more meaningful than total traffic alone.
Frequently Asked Questions
What is branded vs non-branded traffic?
Branded traffic is defined as organic search traffic generated from queries that contain your brand name or brand variations, while non-branded traffic comes from queries that do not reference your brand. Non-branded traffic is the primary measure of SEO-driven discovery because it reflects visibility to users who were not specifically searching for your company.
Branded traffic examples: “sports direct trainers” or “sports direct nike air max”. These users already know your brand and are looking for you specifically.
Non-branded traffic examples: Generic queries like “running shoes” or “waterproof jacket”, where the user has a need but hasn’t chosen a brand yet.
How do I separate branded and non-brand search traffic in Google Search Console?
Natively, Search Console requires you to apply regex query filters manually and export data separately for brand and non-brand queries. Organic Trends automates this – you define your brand terms once, and every query is classified instantly across all months and dimensions, with no spreadsheet work required.
Why is non-branded traffic important?
Non-branded traffic reflects discovery and new customer acquisition through search, making it the most accurate measure of SEO performance.
Can I track brand vs non-brand by page type?
Yes. This is often one of the most useful ways to analyse the split. Looking at category pages, product pages, blog content, or landing pages separately helps reveal where new-user acquisition is really happening and where traffic is overly dependent on existing brand demand.
What percentage of traffic should come from non-brand queries?
There’s no universal answer, but as a guideline: if more than 70% of your organic clicks come from brand queries, you are likely brand-dependent. Healthy sites with strong SEO programmes typically see 50–70% or more of their clicks from non-brand queries. The important thing isn’t a single number, it’s the trend. Is your non-brand share growing or shrinking over time?
Does the tool store my data?
No. All processing happens in your browser. Your Google Search Console credentials are used only for direct API calls to Google. For Bing, data is routed through a minimal same-origin proxy – your API key is never stored. Nothing is logged, saved, or shared.
How far back does the data go?
Google Search Console provides up to 16 months of historical data. Bing Webmaster Tools typically returns around 6 months of query-level data. The tool fetches all available data automatically.
Can I use regex for brand term matching?
Yes. The brand terms input supports full JavaScript regex patterns. For example, you can enter sports?\s*direct to match both “sport direct” and “sports direct”, or frasers?|house\s*of\s*fraser to capture multiple brand variations in one go.
What are CTR curves, and why do they matter?
CTR curves show your actual click-through rate at each SERP position, split by brand and non-brand queries. They matter because the average position alone hides important behaviour. A position 1 ranking with 12% CTR may indicate that SERP features or poor snippet presentation are suppressing your clicks. By monitoring CTR curves over time, you can detect when Google layout changes impact your traffic – even when rankings remain stable.
Final Thought
If you don’t know what proportion of your organic performance is driven by brand, you don’t know how strong your SEO actually is. By measuring branded and non-branded traffic separately, you gain a clear and accurate view of your true organic search performance. This distinction is essential for understanding whether your SEO strategy is expanding discovery, increasing visibility, and driving sustainable organic growth.
And once you track that split consistently over time, the value goes beyond reporting. It becomes a decision-making tool. You can identify where SEO is truly creating new demand, where your site is overly reliant on brand, and which page types or topic areas offer the biggest opportunity for future organic growth.